Monitoring the solution
Overview
The Sandbox Studio solution includes observability tools for monitoring the solution resources.
Amazon CloudWatch Application Insights
Sandbox Studio on AWS includes access to Amazon CloudWatch Application Insights to provide automatic detection and alerting for any errors raised by the solution. When a recurring error is detected within the solution, Application Insights will raise an alarm indicating the potential problem.
Currently, active alarms are displayed in the AWS Cloudwatch Console Dashboard. You can also view an overview of all current and previously detected issues for the solution using the CloudFormation Application Insights console.
CloudWatch Application Insights helps you monitor your applications by identifying and setting up key metrics, logs, and alarms across your application resources and your technology stack. It continuously monitors metrics and logs to detect and correlate anomalies and errors. To assist with troubleshooting, it creates automated dashboards for detected problems, which include correlated metric anomalies and log errors, along with additional insights to identify a potential root cause.
To view the CloudWatch AppInsights dashboard for Sandbox Studio:
- Sign in to the CloudWatch console.
- From the left sidebar, under Insights, choose Application Insights.
- Select the Applications tab.
- In the Find applications search box, type the solution name to find the dashboard.
- Select the dashboard, and the application.
The dashboard displays various metrics and logs for your solution.
Cloudwatch log queries
Note: By default, Sandbox Studio will retain all compute logs for one year. You can change this retention period as part of the solution’s Compute stack CloudFormation parameters.
Sandbox Studio provides several pre-populated AWS CloudWatch log insights queries that allow you to troubleshoot issues.
To access log insights queries:
- Sign in to the CloudWatch console.
- From the left sidebar, under Logs, choose Logs Insights.
- On the Logs Insights tab, select Saved and sample queries.
- From the Sample queries, run one of these queries:
- LogQuery — search for all logs related to a specific account, lease, leaseTemplate, or user.
- ErrorLogs — view all recent errors.
- AccountCleanupLogs — view the logs from a specific cleanup execution.
The logs section will display the compute logs for the solution.
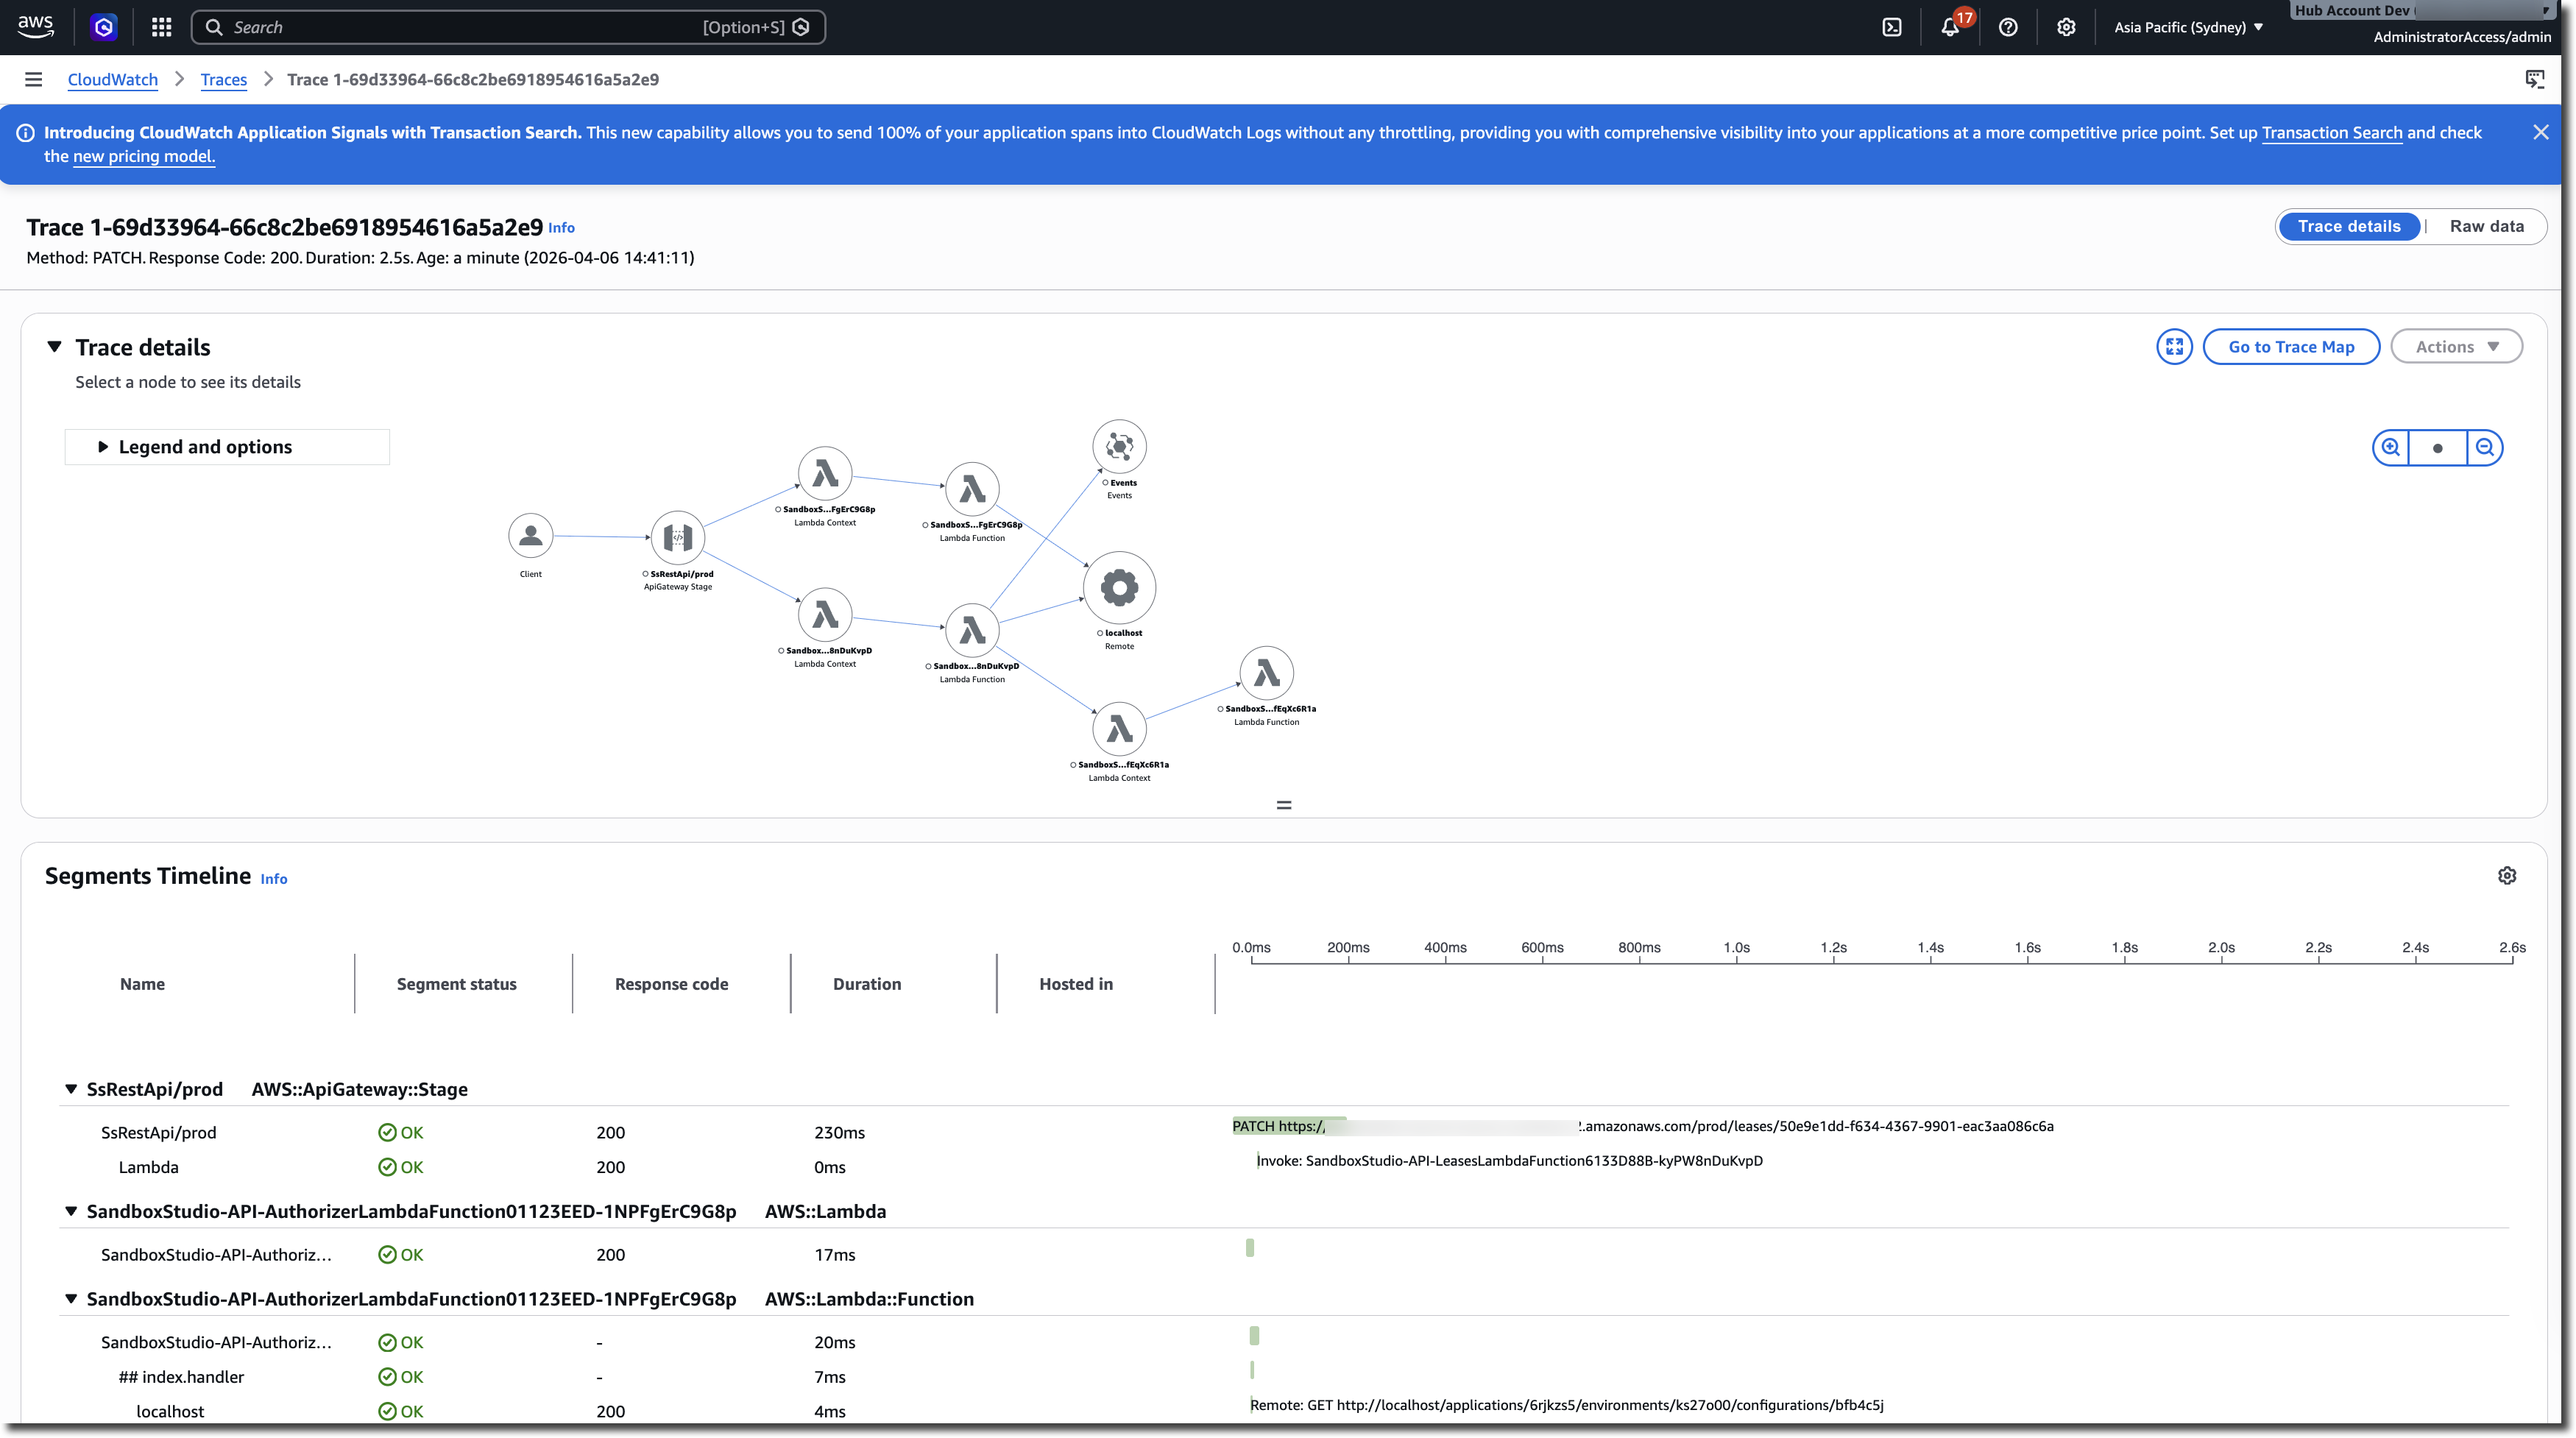
AWS X-Ray
Sandbox Studio includes access to AWS X-Ray for all critical execution paths. This allows you to troubleshoot any failing workflows and identify where the errors are occurring.